Immigration, Refugees and Citizenship Canada (IRCC) has published updated data regarding the processing times for permanent residence, temporary permits, and citizenship applications. Compared to the previous update of September 10, 2025, several important trends have been observed: in some categories, the processing times have shortened, while others have, on the contrary, slowed down significantly.
The greatest changes have been recorded in the sponsorship of spouses and children, especially for applicants planning to reside in Quebec. Delays also persist in the basic PNP streams and Quebec programs, while Express Entry overall demonstrates stability.
1. Permanent Residence
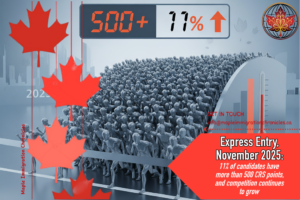
1.1. Express Entry
| Program | Current Processing Time | As of September 10, 2025 | Change | Analysis |
| Canadian Experience Class (CEC) | 6 months | 5 months | +1 mo. | Slight slowdown, but remains within the service standard. Probable reason — increase in the number of applications due to new category-based draws. |
| Federal Skilled Worker Program (FSW) | 5 months | 6 months | −1 mo. | The improvement indicates a recovery of pace after summer delays. |
| Federal Skilled Trades Program (FST) | N/A | N/A | — | The program remains rarely used; data are not published due to the low volume of applications. |
Conclusion: Overall, Express Entry has stabilized — all streams are within the six-month standard.
1.2. Provincial Programs (PNP)
| Stream | Current Time | As of September 10 | Change | Analysis |
| Through Express Entry (Enhanced) | 7 months | 8 months | −1 mo. | Small improvement indicates a decrease in backlog. IRCC is gradually returning to normal levels. |
| Base Stream (Non-EE Base) | 19 months | 19 months | 0 | Base streams remain overloaded — more than one and a half years of waiting. Possible adjustment expected in 2026. |
Conclusion: Enhanced PNP shows improvement, but Base Streams still lag far behind the standard (11 months).
1.3. Quebec (Quebec PSTQ)
| Stream | Current Time | As of September 10 | Change | Analysis |
| PSTQ (Skilled Worker) | 11 months | 11 months | 0 | Lack of change indicates stagnation. About 24,000 cases remain in processing, which exceeds the 6-month standard by nearly double. |
Conclusion: Quebec remains one of the slowest jurisdictions in Canada.
1.4. Atlantic Immigration Program (AIP)
| Stream | Current Time | As of September 10 | Change | Analysis |
| Atlantic Immigration Program | 13 mo. | 13 mo. | 0 | No change may indicate a limited number of officers working with regional streams. |
Conclusion: AIP is stable but exceeds the standard (11 mo.), which may slow down new submissions.
2. Family Sponsorship
| Category | Current Time | As of September 10 | Change | Analysis |
| Spouses in Canada (outside Quebec) | 24 mo. | 23 mo. | +1 mo. | Slight increase within an acceptable range. |
| Spouses in Canada (Quebec) | 37 mo. | 53 mo. | −16 mo. | Significant reduction, but the time remains unacceptably long. Probable reason — backlog clearance. |
| Spouses outside Canada (outside Quebec) | 15 mo. | 15 mo. | 0 | Stable performance within expectations. |
| Spouses outside Canada (Quebec) | 41 mo. | 41 mo. | 0 | No improvement — longest wait time among all categories. |
| Parents/Grandparents (outside Quebec) | 26 mo. | 26 mo. | 0 | No change. IRCC maintains stability, but the excess over standards is significant. |
| Parents/Grandparents (Quebec) | 44 mo. | 41 mo. | +3 mo. | Slight increase, possibly related to additional document checks. |
Conclusion: The longest wait times are in Quebec. IRCC has not yet set fixed standards, but the trend toward reduction for certain categories is positive.
2.1. Child Sponsorship
Inside Canada
| Current Time | As of September 10 | Change | Analysis |
| 12 mo. | 29 mo. | −17 mo. | Significant reduction — result of targeted acceleration of child cases, which had priority. |
Outside Canada
| Country | Current Time | As of September 10 | Analysis |
| India | 6 mo. | N/A | Positive result, time below standard. |
| Nigeria | 18 mo. | N/A | 1.5× longer than the standard. Requires additional IRCC attention. |
Conclusion: In-Canada applications are processed much faster than in 2024. Applicants from Africa should expect longer processing times.
3. Temporary Residence
3.1. Visitor Visas
| Country | Current Time | As of September 10 | Change | Analysis |
| Canada | 15 days | 13 days | +2 days | Slight increase, possibly due to internal system updates. |
| India | 75 days | 63 days | +12 days | Queue growth — likely due to seasonal workload. |
| Pakistan | 46 days | 48 days | −2 days | Slight improvement. |
| Nigeria | 28 days | 31 days | −3 days | Trend toward stabilization. |
| USA | 23 days | 24 days | −1 day | Remains within the norm. |
Conclusion: Most regions show minor fluctuations. The slowest — India.
3.2. Work Permits
| Country | Current Time | As of September 10 | Change | Analysis |
| Canada | 196 days | 190 days | +6 days | Slight increase. The issue persists — time exceeds the standard twofold. |
| India | 8 weeks | 8 weeks | 0 | Stable within expectations. |
| Pakistan | 12 weeks | 12 weeks | 0 | No change. |
| Nigeria | 11 weeks | 22 weeks | −11 wk. | Significant improvement, IRCC has relieved the backlog for this direction. |
| USA | 3 weeks | 3 weeks | 0 | Fastest processing among all directions. |
Conclusion: Domestic applications remain slow; Nigeria shows a breakthrough.
3.3. Study Permits
| Country | Current Time | As of September 10 | Change | Analysis |
| Canada | 7 wks | 6 wks | +1 wk | Slight increase, possibly due to a surge in internal applications after September refusals. |
| India | 4 wks | 4 wks | 0 | Most stable direction. |
| Pakistan | 9 wks | 9 wks | 0 | No change. |
| Nigeria | 8 wks | 8 wks | 0 | No change, but above the standard. |
| USA | 10 wks | 10 wks | 0 | Longer than most countries, possibly due to double status checks. |
Conclusion: The system is stable, but domestic (Canada) applications are processed slower than expected.
3.4. Super Visas
| Country | Current Time | As of September 10 | Change | Analysis |
| India | 153 days | 139 days | +14 days | Slight increase — possibly due to higher volumes of applications after summer campaigns. |
| Pakistan | 151 days | 112 days | +39 days | Largest increase among all countries (+6 weeks). |
| Nigeria | 52 days | 55 days | −3 days | Consistently below standard. |
| USA | 78 days | 89 days | −11 days | Minor delay. |
Conclusion: Pakistan shows a sharp slowdown, while other countries remain within fluctuations.
4. Citizenship
| Category | Current Time | As of September 10 | Change | Analysis |
| Citizenship (grant) | 13 mo. | 11 mo. | +2 mo. | Slight slowdown; possibly due to increased workload after IRCC PR campaigns. |
| Citizenship Certificate | 7 mo. | 5 mo. | +2 mo. | Minor increase, yet still acceptable. |
Conclusion: A trend toward slight slowdown, but overall indicators remain within normal range.
5. How IRCC Calculates Processing Times
IRCC distinguishes between historical and projected times.
Historical times are based on how long it took to process 80% of cases in the past.
Projected times are calculated considering the current backlog.
Key influencing factors:
- completeness of documents;
- speed of response to IRCC requests;
- complexity of data verification;
- workload of the specific visa office.
Conclusions
- Express Entry and Enhanced PNP demonstrate stability, but Quebec’s PSTQ and Base Streams remain the slowest.
- Family sponsorship in Quebec faces the largest delays, while in the rest of Canada a gradual reduction is observed.
- Child cases have become IRCC’s priority — processing times have sharply decreased.
- Temporary permits are stable, except for seasonal fluctuations in India and Pakistan.
- Citizenship shows a slight slowdown, but IRCC maintains performance within acceptable limits.
General trend — partial system relief, but uneven across regions. Quebec and Base Streams require reform or additional resources.